|
In this article: |
To begin, simply add the app you're interested in and select a country.
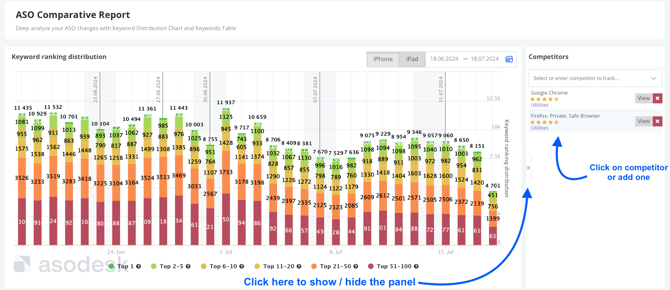
The first feature you'll see is the Keyword ranking distribution chart, which shows statistics on the daily ranking of keywords for your app in a selected country.
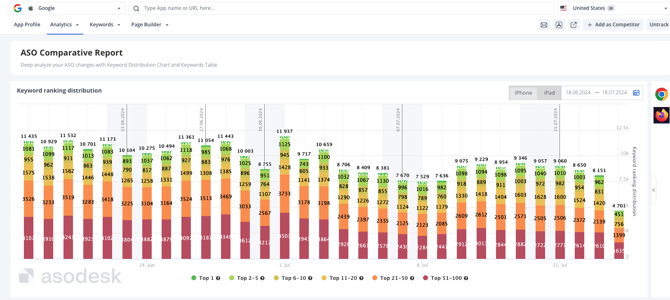
You can choose the time period you're interested in, or choose from the pre-defined time periods available.
By default, data for the last 30 days is displayed.
The color scheme shows how each keyword is performing compared to your app's overall performance.
This feature provides a clear and illustrative view of how keywords are performing, allowing you to evaluate the effectiveness of your ASO specialist's work and determine if ASO optimization has been successful. It gives you a complete picture of how well your keywords are performing and how they have changed over time.
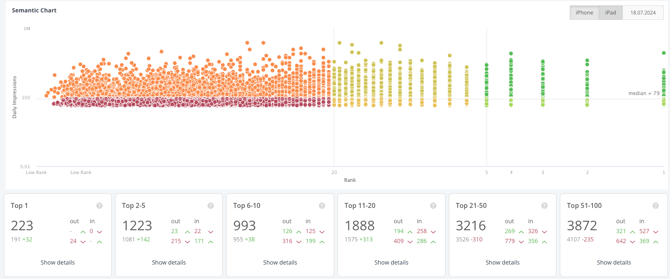
Next, you can explore the Semantic Chart, which shows how many keywords you've ranked and where they're ranked.
You can also examine how the ranking of different keywords changes over time and view this information on a graph. This allows you to compare how well keywords performed between the first and last dates you selected.
Next, you will find a table containing all keywords that had Rank and Daily Impressions during the selected timeframe. You can see each keyword for which your application is indexed and how its performance has changed over time.
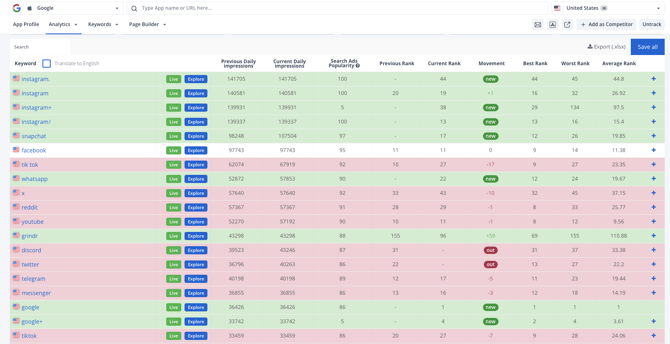
This data can be exported for further analysis.

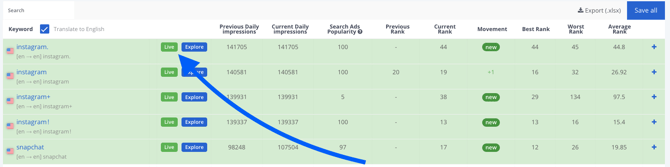
Additionally, you have the option to translate all keywords into English for easier understanding.
Click on "live" to see the current search results for a specific keyword. If you want to explore further, it will then take you to Search Explorer.
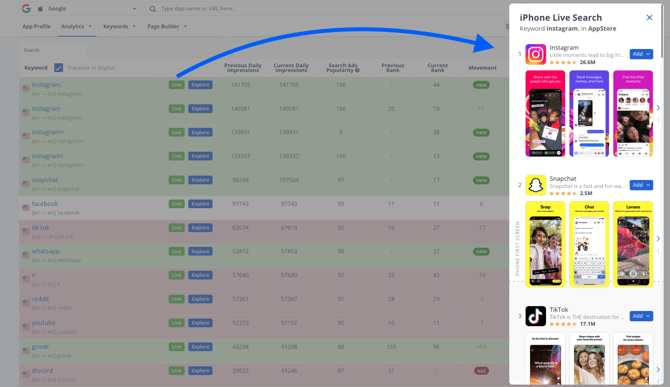
- Previous Daily Impressions show the number of impressions recorded on the first day of the period you have selected in a particular country.
- Current Daily Impressions show the impressions on the last day of the period you have selected.
- Search Ads Popularity metric indicates the popularity data obtained from Apple Search Ads.
- You can also see the Ranks for the first and last days of your chosen period. This allows you to see how your rank has changed over time.
You can easily track keywords from this table. Simply click the plus button and the keywords will be added to the table in Find & Track. There you can do further analysis and work on them.
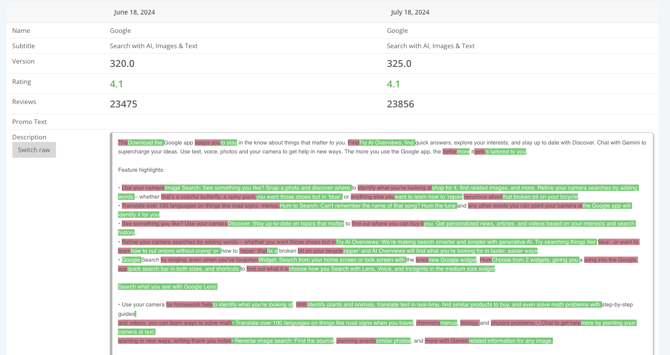
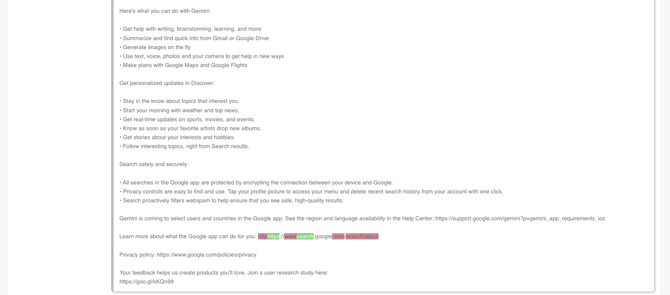
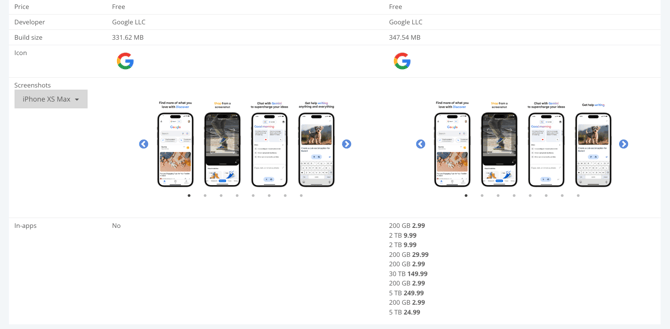
You can also track metadata changes at the bottom of the page. This includes changes to the app's name, subtitle, description or versions during the selected time period.
Additionally, you can select competitors and track their performance as well. All competitors are displayed to the right of the Keyword ranking distribution chart. If you have already added a competitor, simply click on it to see the information you need.
This lets you keep an eye on your competitors, spot any changes they make, and even export their full lists of ranked keywords for more analysis.
Click here to read our guide on how to add competitors.
Need help understanding our products or services? Have a question? Let us know!
Click the support icon in the bottom right corner or write on hello@asodesk.com